On Inequality
Inequality
Absolute Poverty
https://in.reuters.com/article/idINIndia-28923020070810 - According to this article,
people living below 20rs a day as of 2008 is more than 78%.
people living below 20rs a day as of 2008 is more than 78%.
https://www.washingtonpost.com/news/worldviews/wp/2018/07/10/india-is-no-longer-home-to-the-largest-number-of-poor-people-in-the-world-nigeria-is/ -
According to this, people living below 1.9$(or 120₹) is 5% as of 2018.
According to this, people living below 1.9$(or 120₹) is 5% as of 2018.
https://www.thehindubusinessline.com/economy/india-lifted-271-million-people-out-of-poverty-in-10-years-un/article28403303.ece# -
According to this, India has lifted 271 million people out of poverty from 2006 to 2016.
According to this, India has lifted 271 million people out of poverty from 2006 to 2016.
We have to conclude from the above 3 articles that there is some kind of manipulation
of statistics by the world bank whose report appears predominantly in the business press.
of statistics by the world bank whose report appears predominantly in the business press.
https://www.jagranjosh.com/general-knowledge/definition-poverty-poverty-line-in-india-1448357553-1 - Article
published on (2015) - The data pegged the poverty ratio at 29.8% of the population in 2009-10,
down from 37.2% in 2004-05.
However, in recent times, various committees led by economists have come up with different
ways to measure the extent of poverty. The official line delivers a poverty rate of around 32%
of the population.
A committee under Suresh Tendulkar estimated it at 37%, while another led by NC Saxena
said 50%, and in 2007 the Arjun Sengupta Commission identified 77% of Indians as "poor
and vulnerable".
The World Bank's PPP estimate of Indian poverty was higher than 40% in 2005, while the
Asian Development Bank arrived at almost 50%.
The UNDP's Multidimensional Poverty Index finds the proportion of the poor to be higher than
55%.
World Bank Manipulations in ‘Global’ Poverty Statistics

https://www.commondreams.org/views/2017/11/06/extreme-poverty-cut-half-only-minds-capitalists - Extreme
Poverty Cut in Half? Only in the Minds of the Capitalists.
Poverty Cut in Half? Only in the Minds of the Capitalists.
Extreme Poverty Has INCREASED, in Terms of Wealth
A widely held misconception is that global inequality between countries is declining because of growth in
China and other developing countries. But that claim is generally made concerning income inequality, and it is
only partially true.
Global income inequality is down only in relative terms, in the sense that an income boost from $1 to $2
a day is greater in percentage than an income boost from $1,000 to $1,500 a day.
The Poverty Threshold is Absurdly Low
Instead of a 5$(UNCTD) or 10$(ActionAid) threshold, the WB threshold is 1.90$.
Besides, 1.01 in 1985 is equivalent to 2.10$ in 2011 PPP after accounting for inflation. So there’s the
lie(misrepresentation).
lie(misrepresentation).
Taking Credit for China, and Further Fudging the Numbers
Most of the so-called "escape from poverty" has occurred in China, where starting in the 1980s millions of
residents of farming communities moved en masse to the cities for jobs in the factories of technology and in
service-related positions.
residents of farming communities moved en masse to the cities for jobs in the factories of technology and in
service-related positions.
The UN's Millennium Development Goals (MDGs) took advantage of this in the year 2000, calling for a halving
of poverty, but backtracking to the year 1990 to include the income gains across China.
The UN also revised statistical and caloric standards to ensure that its poverty reduction goals were reached
of poverty, but backtracking to the year 1990 to include the income gains across China.
The UN also revised statistical and caloric standards to ensure that its poverty reduction goals were reached
China may have pulled millions "out of poverty,"
but in reality, they've gained a few dollars a day while the country has become increasingly unequal in
terms of wealth. The new Chinese "middle class" has in many ways gone backward.
terms of wealth. The new Chinese "middle class" has in many ways gone backward.
More: https://medium.com/@aaronsd1996/debunking-capitalist-sophistry-8a62c9a992a7 - Capitalism Has
Not “Lifted Billions Out of Poverty” Nor Has Economic Growth “Benefited The Environment”
Not “Lifted Billions Out of Poverty” Nor Has Economic Growth “Benefited The Environment”
https://www.theguardian.com/commentisfree/2019/jan/29/bill-gates-davos-global-poverty-infographic-neoliberal -
Bill Gates says poverty is decreasing. He couldn’t be more wrong
Bill Gates says poverty is decreasing. He couldn’t be more wrong
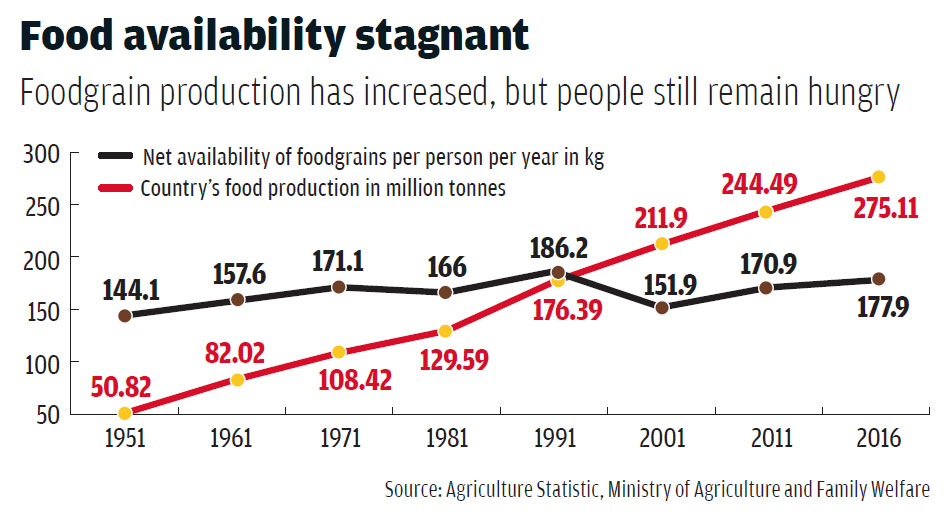
Per capita food consumption
Per capita, food consumption has, in fact, decreased in comparison to 1989(the eve of
neoliberal reforms) from 186.2 kg to 177.9 kg.
Compare this to 800 kg per capita consumption of the US. While at the same time,
substantial amounts of food were being exported. -
neoliberal reforms) from 186.2 kg to 177.9 kg.
Compare this to 800 kg per capita consumption of the US. While at the same time,
substantial amounts of food were being exported. -
“In the nutritional sense at least and therefore perhaps in terms of real income, people are
worse off than the period at the beginning of liberalization, if the figures are appropriately deflated.”
- Prabhat Patnaik on Indian Economy(2019)
worse off than the period at the beginning of liberalization, if the figures are appropriately deflated.”
- Prabhat Patnaik on Indian Economy(2019)
Due to privatization, there has been a decrease in the purchasing power of the working class(deflation).
Calorie consumption(Nutrition)
The urban poverty level is 2100 and the Rural poverty level is 2200.
According to Prabhat Patnaik, the percentage of people who are falling below this level has gone up :
Oxfam on Inequality

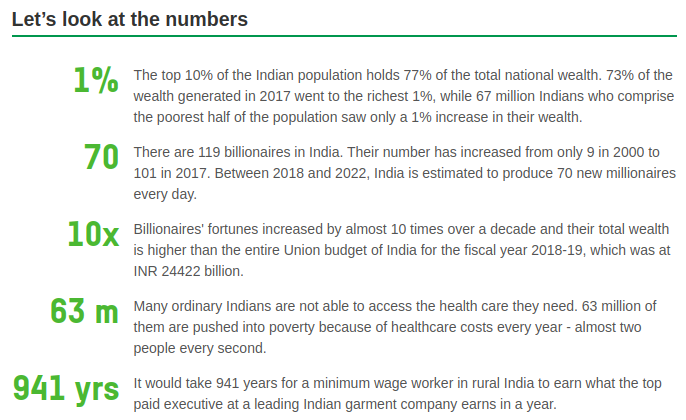
9 Richest Indians now own wealth equal to the bottom half of the population.
India added 18 new billionaires to the list just last year, taking the total number of billionaires
in the country to 119. Their total wealth is higher than the Union Budget of India for
2018-2019 (Rs 24,422 billion), the report says.
in the country to 119. Their total wealth is higher than the Union Budget of India for
2018-2019 (Rs 24,422 billion), the report says.
The country’s combined revenue and capital expenditure of the Centre and states for public
health, sanitation, and water supply are less than the wealth of India’s richest billionaire
Mukesh Ambani.
health, sanitation, and water supply are less than the wealth of India’s richest billionaire
Mukesh Ambani.
Inequality in India is based not just on class but caste, but gender as well. “A Dalit woman
can expect to live almost 14.6 years less than one from a high-caste,” the report says,
asserting that this inequality costs India its human potential.
can expect to live almost 14.6 years less than one from a high-caste,” the report says,
asserting that this inequality costs India its human potential.
“Getting the richest one percent in India to pay just 0.5 percent extra tax on their wealth
could raise enough money enough to increase government spending on health by
50 percent,” the report(Oxfam Inequality Report 2019) says.
- https://thewire.in/rights/9-richest-indians-now-own-wealth-equivalent-to-bottom-50-of-the-population
could raise enough money enough to increase government spending on health by
50 percent,” the report(Oxfam Inequality Report 2019) says.
- https://thewire.in/rights/9-richest-indians-now-own-wealth-equivalent-to-bottom-50-of-the-population
Rich got more filthy Rich
https://www.businessinsider.in/gautam-adanis-wealth-multiplied-nearly-3-times-in-the-last-four-years/slidelist/71304650.cms
- Gautam Adani's Wealth Multiplied Nearly 3 Times In The Last Four Years(2019)
- Gautam Adani's Wealth Multiplied Nearly 3 Times In The Last Four Years(2019)
World Bank gives priority to poverty over inequality

https://thewire.in/economy/inequality-poverty-identity-politics - Inequality, Not Poverty,
is Behind the Global Rise of Identity Politics
is Behind the Global Rise of Identity Politics
...The more the absolute view of poverty is abandoned in favor of a relative view of poverty,
the weaker becomes the evidence in support of a reduction of poverty…
the weaker becomes the evidence in support of a reduction of poverty…
...Lucas Chancel and Thomas Piketty (Indian Income Inequality, 1922-2015: From British Raj
to Billionaire Raj?) have noted that while during 1950-1980 inequality in India fell,
the situation reversed itself drastically during 1980-2015 with the top 1% pulling away
from the rest: ‘the share of income accruing to the top 1% is at its highest since the
creation of the income tax act in 1922’.
Income Share

The income share of the top 1 percent, which hovered around 10 percent in the early
1990s has consistently increased since, reaching 21 percent in 2016. On the contrary,
the bottom 50 percent takes home less than 15 percent of the total share as of 2016.
- https://www.firstpost.com/business/more-than-half-of-worlds-income-went-
to-top-10-of-population-india-has-highest-income-inequality-among-major-global-economies-7470341.html
Rural Inequality
https://www.epw.in/engage/article/indian-democracy-has-failed-advance-redistributive-reforms-marginalised-groups -
Indian Democracy Has Failed to Advance Redistributive Reforms for Marginalised Groups
Indian Democracy Has Failed to Advance Redistributive Reforms for Marginalised Groups
First of all, land ownership is profoundly unequal. As few as 7% of India’s rural households
control 47% of the country’s land area, while the remaining 93% of households do not have
land at all, or are relegated to small and marginal holdings (Nilsen 2018b). Approximately
40% of the agricultural workforce is entirely dependent on wage labor for their livelihoods,
while the majority of cultivators have such smallholdings that they are compelled to
supplement cultivation with wage labor.
All the food in the world!

Conclusion
GDP has increased, but this increase has only benefited the top 1% and the middle
and upper classes who make up less than 15% of the population.
The poor have gotten poorer. Per capita, calorie consumption has fallen over the whole
The poor have gotten poorer. Per capita, calorie consumption has fallen over the whole
period. Calorie consumption has fallen also.
Employment has been shrinking due to the proliferation of the private sector.
World Bank, United Nations’ and others’ statistics on poverty vary wildly, carefully
Employment has been shrinking due to the proliferation of the private sector.
World Bank, United Nations’ and others’ statistics on poverty vary wildly, carefully
avoid mentioning relative poverty which has increased and has not accounted for
inflation across time. Hence they should be considered as heavily ideologically motivated
propaganda pieces.
Rich got a lot richer.
There is more than enough food production, but people don’t have the purchasing power
Rich got a lot richer.
There is more than enough food production, but people don’t have the purchasing power
necessary to buy it. This is due to privatization (increased exploitation) and lack of job
growth(due to increased productivity).
Claims about dramatic decreases in ‘poverty’ due to capitalism are BLOODY LIES.
Claims about dramatic decreases in ‘poverty’ due to capitalism are BLOODY LIES.
Death to the Rich parasites! Long live Revolution!

Comments
Post a Comment